Battlefield Mean Business
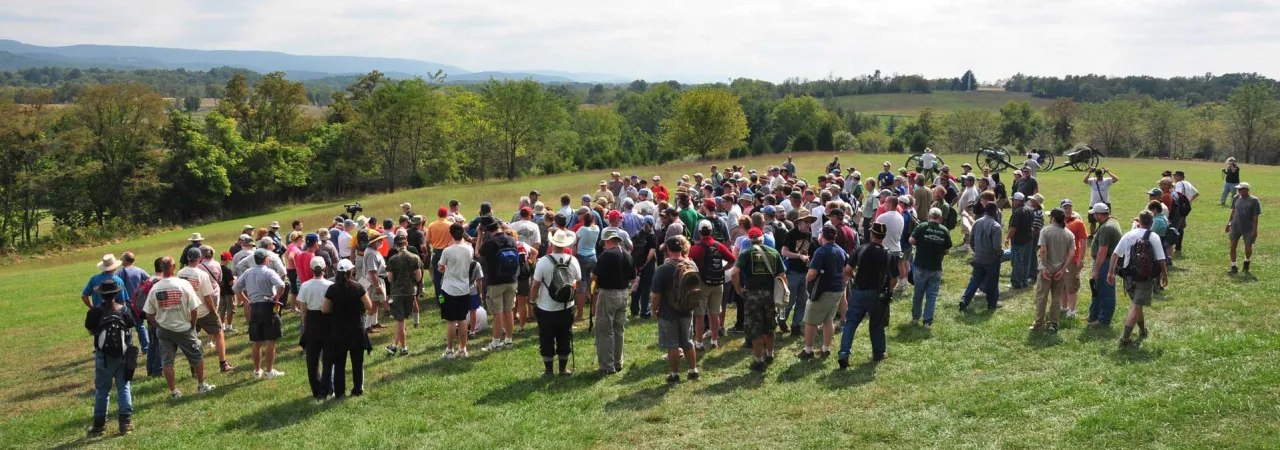
Antietam National Battlefield, Sharpsburg, Md.
Many of us involved in historic preservation pursue such initiatives because we believe in the power of place and understand the educational value such sites present to locals and visitors alike. Unfortunately, such wisdom is not universally accepted, and sometimes we must persuade neighbors and even decisionmakers that the benefits are wide reaching and apply to more than a small circle of hobbyist reenactors.
For officials on both sides of the aisle, the economic impact of heritage tourism can make a compelling case that preservation initiatives could be a good fit for their communities and constituents. Yet without the means to generate independent statistical analysis for your individual museum or park, how can you offer a tangible measure that will appeal to their bottom-dollar way of thinking? If you can bear to part with this issue of Hallowed Ground, they may find the full breadth of articles enlightening! But with a bit of internet research, you can present them with relevant case studies using data professionally prepared by the National Park Service (NPS) — minimal number crunching required.
The National Park Service records and prepares a number of robust social science metrics that measure use and value of units, releasing figures each autumn — both amalgamated metrics for the entire system and individual metrics for specific parks and/or regions. Visit www.nps.gov/socialscience for the latest data sets.
The first category of research to understand is Visitor Use Statistics, which provides detailed counts about park use. When reviewing these charts, it is important to understand the differentiation between “visits” and “visitors” — a single visitor may generate multiple counted visits by leaving and re-entering a park, say for lunch at an off-site restaurant. A couple who spends their first day at Vicksburg National Military Park taking the driving tour, returns to their hotel for the night and comes back the next morning to hike has accrued a total of four visits to the park. You should also concentrate on “recreational” users, rather than “non-recreational” ones, who might include those who commute through the park daily. Also note that overnight stays reported in this data set only account for those staying in facilities officially affiliated with the Park Service, like a lodge or campground.
As you delve into these data, take note of the caveat made by the Park Service itself: The accuracy of older data is uncertain. Visitation numbers are available for some parks as far back as 1904, but prior to the mid-1980s, NPS has said, “[N]o standard Service-wide system existed for counting visitors. As a result, a considerable amount of mathematical errors and double-counting occurred.” This admission helps put into context occasionally cited outliers like the seven million people purported to have visited Gettysburg National Military Park in 1970 — more than three times the number of visitors counted at Grand Canyon National Park that same year.
Even with more recent information, it may be helpful to look at multiyear averages to control for extenuating circumstances: A major anniversary and reenactment one year, followed by a summer of record rainfall the next can obscure meaningful trends. Using this model to control for natural fluctuations, Trust-sponsored analysis by the Harbinger Group showed that, in 2019, battlefield tourism was on the upswing, with an adjusted 21-percent increase in visitors to 11 nationally significant battlefields between 1990 and 2018 when using three-year averages (the period 1990- 1992 compared to the period 2016-2018).
As impressive as the number of people passing through a battlefield park might be, that raw information does not convey the impact their presence creates in the surrounding community, which sprouts business to cater to them. Thanks to what economists call the “multiplier effect,” local businesses spend the visitor dollars they take in to pay employees, buy goods and cover other expenses. Money these businesses spend can then be spent again by the businesses and individuals who receive it, and so on down the line. The dollars you spend in the community to take a room at the Battlefield B&B will pay the salaries of staff who will spend it outside of the tourism industry but still within the local community.
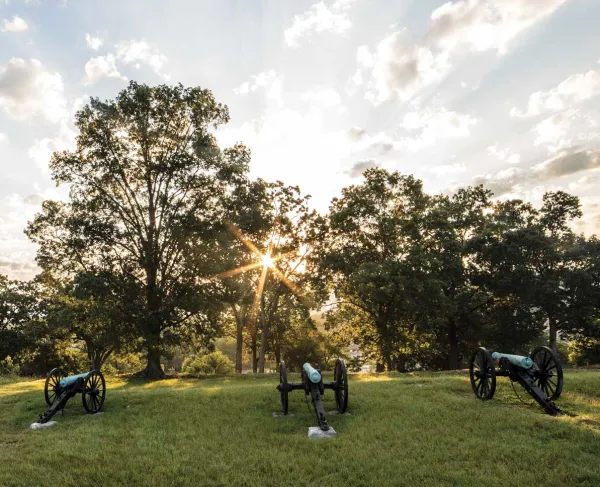
ANTIETAM NATIONAL BATTLEFIELD
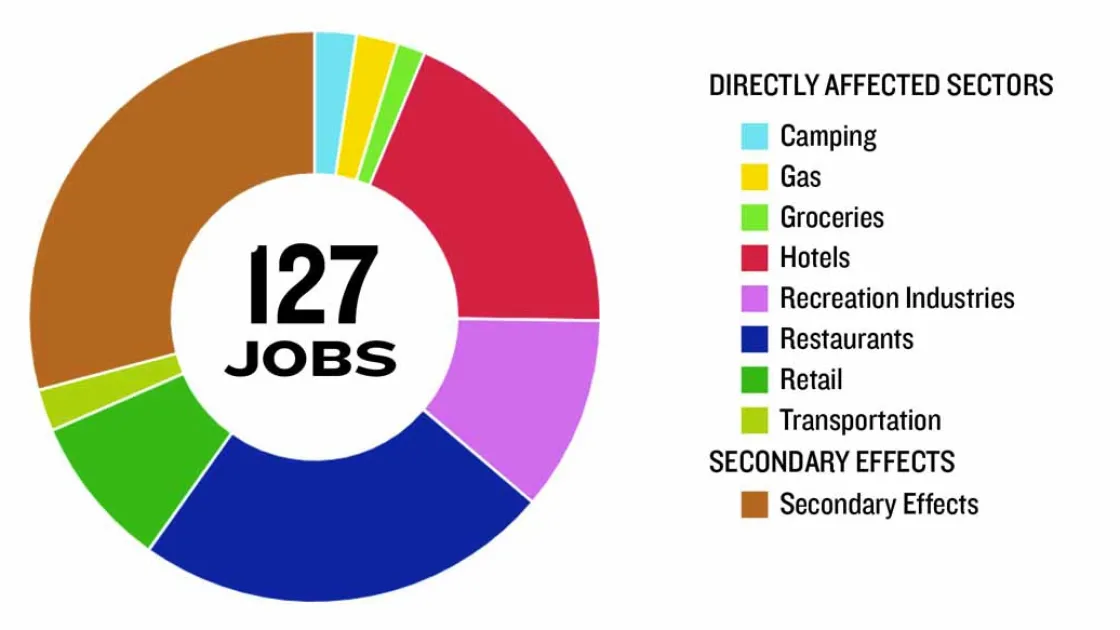
In 2023, 154,000 park visitors spent an estimated $10.3 million in local gateway regions wile visiting Antietam National Battlefield. These expenditures supported a total of 127 jobs, $5.8 million in labor income, $9.5 million in value added, and $15.3 million in economic support output in local gateway economies supporting Antietam National Battlefield.
Source: National Park ServiceFor each of the 400-plus units in the system, the National Park Service reports its analysis of impact in a number of categories via the “Park Economies” tab of its Visitor Spending Effects portal. These include Visitor Spending (how much visitors spend in a park’s gateway communities), Jobs (annualized full- and part-time jobs supported by visitor spending), Labor Income (employee wages, salaries and payroll benefits, plus sole proprietor incomes, of those jobs), Value Added (contribution of visitor spending to the region’s Gross Domestic Product) and Economic Output (total estimated value of the production of goods and services supported by National Park Service visitor spending).
The secondary effects of heritage tourist spending as it ripples outward in a community can yield numbers that feel bogglingly high and can require nuanced explanation of the difference between direct and indirect impact. In many instances, though, the simple figures of dollars spent and jobs supported are straightforward and sufficient to convey the underlying premise.
For each park, the portal can produce a swift analytic summary of these numbers and even a pie chart demonstrating proportional spending across economic sectors (retail vs. restaurants, etc.) and the type of jobs created for which sectors of the economy. For example: In 2023, the jobs created surrounding Appomattox Court House National Historical Park were twice as likely to be related to lodging or restaurants than to retail. A handy bar graph shows high-level information in each category compared across the past decade.
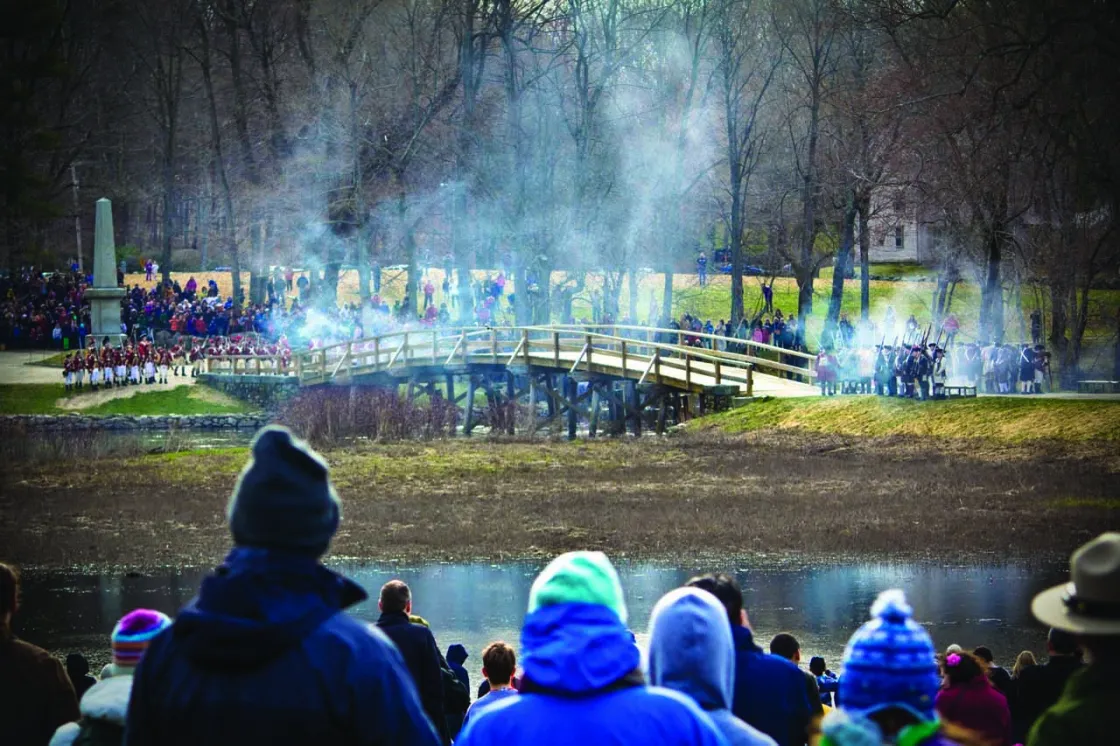
Visitors watching a reenactment at Minute Man National Historical Park in Concord, Mass.
James WellmanWhen browsing this information, resist the temptation to compare your smaller site to Gettysburg! Instead, choose a more rural site or one that hasn’t spent 150 years investing in attracting visitors to the battlefield and creating robust infrastructure to support them. Such more-modest examples are likely more meaningful, realistic and tangible to those you are looking to persuade. Take Ninety Six National Historic Site, a Revolutionary War battlefield in rural South Carolina that’s 35 miles from the nearest interstate highway. That its 118,000 visitors in 2023 spent $7.9 million in surrounding towns and supported a total of 111 jobs is a far more reasonable expectation and goal to work toward.
The newest tool in the publicly available NPS analytic arsenal is Socioeconomic Measurements; following a pilot program in 2015, this data collection began in earnest in 2022. Because this type of information is more dependent on individual survey work than economic formula calculation, each year's unique reporting is based on data gathered at two dozen randomly selected parks that represent a cross-section of the system. Selected sites are meant to proportionally include cultural, natural and recreational sites and control for rural/ urban divides and high/low visitation flows.
Surveys completed in 2023 at Fort Donelson National Battlefield and Stones River National Battlefield yielded meaningful and detailed information on a host of topics ranging from party age and distance traveled to how many hours were spent within the park. Trip inspiration and programs experienced were also measured. (Fear not! In both cases, 75+ percent said learning more about American history was either Very or Extremely important to them during their visit.) Information gleaned from 2024 sites surveyed, which include Vicksburg National Military Park, Wilson’s Creek National Battlefield, Kennesaw Mountain National Battlefield Park and Minute Man National Historical Park should be available later in 2025.